Creating a G-3 GUI with Python
Related Documentation:
Index of GENESIS 3 User Tutorials
Creating GENESIS 3 Simulations with Python
Introduction
The previous tutorial in this sequence, Creating GENESIS 3 Simulations with Python, concluded with the description of the example script, simplecell_pulse_sim.py. This is an object-oriented non-graphical simulation script that can either run the simulation non-interactively when used alone, or used as a module by other scripts.
This tutorial describes how 'simplecell_pulse_sim.py' can be used in a graphical environment with a Control Panel to set model and simulation parameters and run the simulation, and with graphs for plotting results. This modular decoupling of the graphical and non-graphical aspects of the simulation makes it easy to develop them independently and to reuse them with different models. In the future, it will simplify the process of running them in separate threads or processor cores.
As described in the previous tutorial, when 'simplecell_pulse_sim.py' is run as a main script, it creates a G3Sim instance 'mySim', sets injection parameters and outputs, then runs it for 0.5 seconds, and exits.
Background
Tutorials on neural modeling with GENESIS 2 in Part II of "The BoG" and the "GENESIS Neural Modeling Tutorials" package provide a great deal of general information on creating single cell and network simulations with GENESIS, in addition to giving examples of scripting in the GENESIS 2 SLI syntax.
During the transition from GENESIS 2 to GENESIS 3 (G-3), as these examples are converted to examples using Python scripting, these older tutorials will continue to be used. They gradually introduce the scripting of GUIs for control and viewing of simulations, using the XODUS extensions to the SLI syntax. Over these tutorials, the commands were introduced to build a standard Control Panel XODUS "form" (which is caled a "Frame" in wxPython).
One of the strongest features of GENESIS 2 is that users can script custom GUIs for their simulations, using XODUS widgets for the usual buttons, toggles, text entry fields, and visualization widgets such as the network view and graph.
Variations of the GENESIS 2 Control Panel were used throughout the BoG and the Modeling Tutorials package in examples of scripting GUIs for single cell and network models. These examples provided templates that users could modify and extend for use in their own simulations. This also made it possible for users to turn their research simulations into tutorials with user-friendly interfaces, as was the case with many of the simulations in the BoG. However, this came with the restriction that they had to be programmed in the simulator- and platform-dependent SLI syntax with somewhat idiosyncratic XODUS commands.
The 'simplecell2' model, and others used in the GENESIS 2 tutorials, create Control Panel windows and graphs similar to the one in Fig. 1 below.
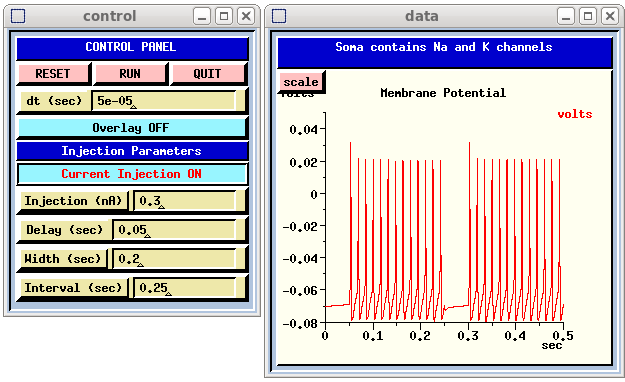
Fig. 1: The simplecell model GUI provided by GENESIS 2 simplecell2.g
The purpose of the present tutorial is to illustrate the similar process of creating a Control Panel for G-3 simulations using the wxPython package for the wxWidgets set in Python, plus some modules developed for G-3. The hope is to generate a well-written template that can be likewise modified and extended.
The example used in this tutorial creates a GENESIS 2 style Control Panel using a custom Python G-3 widget set G2Xwidgets to create the similar Control Panel and graph display shown in Fig. 2.
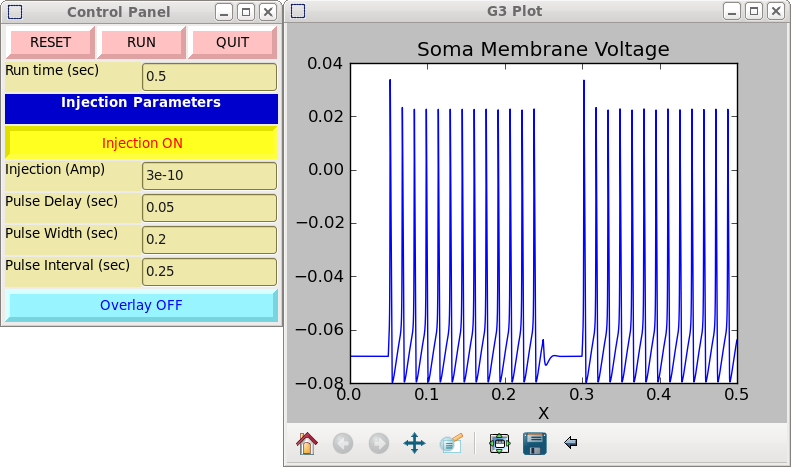
Fig. 2: The simplecell model GUI provided by GENESIS 3 simplecell_pulse_main.py
Creating the Control Panel
An Overview of XODUS Widgets
The figure illustrates four basic types of widgets that are available in XODUS and in wxPython libraries.
The GENESIS 2 Control Panel has an 'xlabel' with white text on a dark blue background at the top, and another further down. It is followed by a row of pink buttons created with the XODUS 'xbutton' object. There are several examples of the 'xdialog' widget, for which there is no wxPython equivalent. This "dialog" widget is not the usual pop-up dialog window, but is what some graphics packages call a "labeled text entry widget". It can be implemented with a combination of a label and a widget for text entry (e.g. the wxPython TextCtrl).
There are two examples of the toggle widget, with one OFF and the other ON. The XODUS 'xtoggle' has the feature of not only changing the text when toggled ON or OFF, but the foreground and background colors.
In order to produce either of these control panel windows, there are six steps:
- Create the container for the widgets. In GENESIS 2, this window is called a 'form'. In wxPython, it is a 'Frame' or, more often, a 'Panel' that is contained within a Frame.
- Create the needed widgets, and make any desired changes in color or appearance (at the time of creation, or in a separate step).
- Add the widgets to the container, arranging the layout as desired.
- Associate each widget (except for a label) with an event, such as a mouse click or an 'Enter' in a text field, and with a command or function to be invoked.
- Define the functions to be invoked by the widgets after an event occurs.
- Display the form or Frame.
Alhough an examination of the SLI script that produced the GENESIS 2 Control Panel may seem of interest only to students of dead languages, it is useful to see what mappings should be made when converting GENESIS 2 simulations that contain graphics into G-3. A typical 'graphics.g' file included in a GENESIS 2 simulation will have a function definition similar to:
function make_control
    // Make a form at [xpos, ypos, width, height]
    create xform /control [10,50,300,135]

    // Create and position widgets within the form; bind to a script function
    create xlabel /control/label -label "CONTROL PANEL"

    // Arrange the next three widgets in a row
    create xbutton /control/RESET -wgeom 33%       -script reset
    create xbutton /control/RUN -xgeom 0:RESET -ygeom 0:label -wgeom 33% \
         -script step_tmax
    create xbutton /control/QUIT -xgeom 0:RUN -ygeom 0:label -wgeom 34% \
        -script quit

    create xlabel /control/injlabel -label "Injection Parameters"

    create xtoggle /control/injtoggle -label "" -script inj_toggle
    setfield /control/injtoggle offlabel "Current Injection OFF"
    setfield /control/injtoggle onlabel "Current Injection ON"
    setfield /control/injtoggle  state 1 // Set it to ON
    inj_toggle     // initialize injection state
    create xdialog /control/Injection -label "Injection (amperes)" \
              -value 0.3e-9 -script "set_inject <widget>"

    // Use 'wildcard' notation to set the colors of particular widget types
    setfield /##[ISA=xlabel] fg white bg blue3
    setfield /##[ISA=xbutton] offbg rosybrown1 onbg rosybrown1
    setfield /##[ISA=xtoggle] onfg red offbg cadetblue1 onbg cadetblue1
    setfield /##[ISA=xdialog] bg palegoldenrod

    // Display the form
    xshow /control
end
In the example above, a 'create' command is used to make the containing '/control' form and the widgets it contains from the XODUS widgets object types (classes) described earlier. Note that steps 2-4 are often combined with arguments to a single command. The -script option can specify the name of a GENESIS command or user-defined SLI script function. The default blue-gray colors of the widgets can be changed individually, or as was done in this example, set with a 'wildcard' syntax according to type.
Overview of wxPython Scripting
This tutorial does not intend to be an introduction to programming with wxPython. Rather, it is a guide to "hacking" existing example scripts in order to create your own custom G-3 GUIs. It should also be helpful for converting graphical simulation scripts used with GENESIS 2 or other simulators.
wxPython is a Python library that implements the wxWidgets set, a cross-platform set of graphical widgets for building GUIs. It is normally installed as part of the G-3 installation. Here a few useful links to on-line documentation for wxPython, collected here in one place:
The primary source for documentation on Python itself is the Python Documentation page.
The wxPython Home Page is the main site for wxPython, with links for documentation, examples, and installation instructions.
The wxPython Wiki is the best starting place to find links to documentation and tutorials. The BoxSizer Tutorial from the Wiki is a good short introduction to laying out widgets in a frame with a BoxSizer. As much as possible, the examples given here for the Control Panel have followed the examples in the Style Guide for wxPython code.
To find more about the properties of the classes used in wxPython, see the references at the wxPython Index of wxWidgets documentation, as adapted for Python. In particular, the links in the list of "Classes by category" give documentation for the parameters and methods of each class, such as those of the wxButton.
The plotting examples require the installation of the Matplotlib library for python, which can be downloaded from http://sourceforge.net/projects/matplotlib. This is not presently a required package for the G-3 installation.
Matplotlib provides powerful scientific graphics capabilities within Python scripts, similar to MATLAB, to easily generate a wide variety of plots, accompanied by a Navigation Toolbar that allows for panning and zooming of plots, and saving to publication quality PNG format images. It is used to provide the graphs used to plot the results in this tutorial, and is the basis of other stand-alone G-3 visualization tools in the G3Plot package, such as raster and contour plots.
An Overview of the Example Scripts
The README file for the package of scripts gives a more detailed description of each script in the package.
In summary, the main script simplecell_pulse_main.py uses the script simplecell_pulse_sim.py that was developed at the end of the previous tutorial Creating GENESIS 3 Simulations with Python, and combines it with a Control Panel and graph.
The following sections of the tutorial examine the Control Panel script, which may be run as a stand-alone example, and then the main simulation script that links the simulation with the Control Panel and the graphics module 'GXgraph.py'. A short section at the end discusses the code for 'GXgraph.py' and the widget set 'G2Xwidgets.py'. These two scripts can generally be imported and used without modification, nor with much understanding of their internals.
The cpanel_pulse_inject.py Script
The Control Panel is formed with the script cpanel_pulse_inject.py. This script defines a generic Control Panel class CPanelFrame(wx.Frame) that provides buttons, "dialogs", labels, and toggles to control a simulation for pulsed current injection to an unspecified single cell. It forms these from custom classes defined in G2Xwidgets.py. When run as a main script, 'cpanel_pulse_inject.py' creates a Control Panel with default labels and dialog entry values. This corresponds to Steps 1-3 and 6 in the procedure outlined above. Steps 4 and 5 are specific to the particular model being used with the Control Panel, so simplecell_pulse_main.py defines the actions that will be performed by mouse clicks or text entry in these widgets.
The script begins with:
#!/usr/bin/env python

# Import the wxPython modules
import wx

# Import the custom widgets that mimic GENESIS 2 widgets import import
import G2Xwidgets as gx

# Create the class that defines the frame and the widgets that it contains

class CPanelFrame(wx.Frame):
    def __init__(self):
        wx.Frame.__init__(self, None, -1, 'Control Panel')
        # Make a panel within the frame to hold the widgets
        self.panel = wx.Panel(self, wx.ID_ANY)
It only needs to import the wxPython and G2Xwidgets modules, as any other Python modules willl be imported by 'simplecell_pulse_main.py' or by modules which it uses. The G2Xwidgets module is a set of class definitions in the file G2Xwidgets.py that are used to create the widgets in the Control Panel. Usually, this file may be used as a "black box" without modification for any of your custom GUIs, but comments in the file and in a later section of this tutorial give some information for customizing it.
The CPanelFrame class is derived from the wxPython Frame class, and will be the template for a frame containing a Control Panel. The Control Panel itself is laid out within an object 'self.panel' that is created from the wxPython Panel class. The 'self' refers to the object that will be created from class CPanelFrame, so that any objects or variables preceded by 'self.' will be accessible.
The '__init__' method performs Step 1 of the procedure when an instance of CPanelFrame is created, and the statements that follow in the '__init__' method perform Steps 2 and 3. These will be discussed shortly, but it is instructive to first look at the '__main__' section of the script. The class definition and its '__init__' definition are followed by:
if __name__ == '__main__':
    app = wx.App()
    frame = CPanelFrame()
    frame.Show()
    app.MainLoop()
When executed, this produces an infinite loop by creating an instance of the wxPthon 'App' class and performing its MainLoop method after creating and showing a frame created from CPanelFrame. The script will not exit until a command or event in 'frame' causes the frame to close, e.g. a click on a 'QUIT' button. We will see that this same usage occurs at the end of 'simplecell_pulse_main.py', which imports both 'cpanel_pulse_inject.py' and 'GXgraph.py'.
Continuing with a tour through the listing of the '__init__' method definition in cpanel_pulse_inject.py we see:
# Create three Button widgets
self.reset_button = gx.XButton(self)
self.reset_button.SetLabel('RESET')

self.run_button = gx.XButton(self)
self.run_button.SetLabel('RUN')

self.quit_button = gx.XButton(self)
self.quit_button.SetLabel('QUIT')

self.tmax_dialog = gx.XDialog(self)
self.tmax_dialog.entry_label.SetLabel('Run time (sec)')
self.tmax_dialog.entry.ChangeValue(str(0.5))

# Add a label using custom wiget based on GenStaticText.
self.inj_label = gx.XLabel(self)
self.inj_label.SetLabel('Injection Parameters')

# The toggle buttons, in particular, need to be globally accessible
self.inj_toggle = gx.XToggle(self)
# Initialize the labels
self.inj_toggle.SetLabel("Injection OFF")
self.inj_toggle.offlabel = "Injection OFF"
self.inj_toggle.onlabel = "Injection ON"
# As an example, change the default background color when ON
self.inj_toggle.onbg = 'yellow'
followed by the creation of more dialogs. This implements Step 2, creating the widgets to be used. Note that they have been created within what will become a frame (self), and not within the panel. At this point there is no indication of how they will be arranged within the panel inside the frame ('self.panel'), and they may be created in any order.
A typical wxPython tutorial (e.g., the example in the Style Guide for wxPython code) would create a button with the statement:
self.run_button = wx.Button(self)
and with similar statements to create a toggle (wx.ToggleButton), label (wx.StaticText), or text entry field (wx.TextCtrl). Here, we use the widgets gx.XButton, gx.XLabel, gx.XToggle, and gx.XDialog to extend the functionality of the wxPython widgets, and provide a standard default appearance with beveled edges and colors to match the XODUS widgets.
The text appearing on a widget is set with the method 'SetLabel(string)', whether it is one of the standard ones or from the G2Xwidgets class.
XDialog is implemented as a label ('entry_label' from the GenStaticText class) plus a text entry field ('entry' from the TextCtrl class). Thus, the label of the dialog for entering the tmax value is set with:
self.tmax_dialog.entry_label.SetLabel('Run time (sec)')
The entry field has a special method for setting the value, which is required to be a string, so the command is:
self.tmax_dialog.entry.ChangeValue(str(0.5))
The toggle buttons offered with wxPython change their appearance from being "out" to "in" when clicked, but do not have the ability to change the text label (e.g. 'OFF' to 'ON'), text color (foreground), or background color, as with the XODUS 'xtoggle' widget. The G-3 XToggle widget extends the GenToggleButton class in order to provide these features by defining variables (and default values) onlabel, offlabel, onfg, offfg, onbg, offbg and a method OnToggle() that changes the the widget appearance according to the toggle state.
In the 'cpanel_pulse_inject.py' script, as an example, the background color of the inj_toggle widget has been set to 'yellow' when the toggle is ON (pressed in). The overlay_toggle, created last, retains its default onbg color of 'cadetblue1' (#98F5FF), which is the same as offbg.
Step 3 in the procedure for creating the Control Panel is to add the widgets to the panel, according to the desired layout. wxPython allows absolute positioning and sizing of widgets, but this tedious process is rarely used. The preferred method is with the use of Sizers, which come in several varieties.
In this this example, and future ones, we will use the BoxSizer, which can be specified as VERTICAL to add widgets one after another from top to bottom, or HORIZONTAL to add them from left to right. The power of the simple BoxSizer is that HORIZONTAL and VERTICAL BoxSizers can be nested to give a wide variety of layouts.
If we wanted the RESET, RUN, and QUIT buttons to be stacked one above the other, as with the rest of the widgets, a single VERTICAL BoxSizer would do. The XODUS example used an obscure syntax to position these buttons in a row below the label. With wxPython, it can be done by putting them in a HORIZONTAL BoxSizer, which is then stacked in a VERTICAL BoxSizer with the others. This is done with the statements:
# Create the main vertical BoxSizer and the horizontal BoxSizers
# for the rows that it will contain (only one row in this case)
sizer = wx.BoxSizer(wx.VERTICAL)
self.row1sizer = wx.BoxSizer(wx.HORIZONTAL)

# Add the row of buttons to the horizontal BoxSizer
self.row1sizer.Add(self.reset_button, 1, wx.EXPAND|wx.ALL, border=1)
self.row1sizer.Add(self.run_button, 1, wx.EXPAND|wx.ALL, border=1)
self.row1sizer.Add(self.quit_button, 1, wx.EXPAND|wx.ALL, border=1)

# Now add the horizontal sizer and widgets to the main vertical sizer
sizer.Add(self.row1sizer, 0, wx.EXPAND|wx.ALL, border=1)
sizer.Add(self.tmax_dialog, 0, wx.CENTER|wx.EXPAND|wx.ALL, border=1)
sizer.Add(self.inj_label, 0, wx.CENTER|wx.EXPAND|wx.ALL, border=1)
sizer.Add(self.inj_toggle, 0, wx.EXPAND|wx.ALL, border=1)
sizer.Add(self.inj_dialog, 0, wx.EXPAND|wx.ALL, border=1)
sizer.Add(self.delay_dialog, 0, wx.EXPAND|wx.ALL, border=1)
sizer.Add(self.width_dialog, 0, wx.EXPAND|wx.ALL, border=1)
sizer.Add(self.interval_dialog, 0, wx.EXPAND|wx.ALL, border=1)
sizer.Add(self.overlay_toggle, 0, wx.EXPAND|wx.ALL, border=1)
Here the Add() method of the sizer is used to add each widget to be arranged in the order that it was added. The argument following the name of the widget or other sizer specifies the proportion, in order to specify how much an item is stretched when the parent window is resized. We want the three button to fill the panel, with each being the same size, so this value is '1' for all of them. If one button was to be twice as long as the others, it would have the value '2'. The vertically stacked widgets should keep their default or assigned heights when the panel is stretched vertically, so they use the proportion '0'. The remaining arguments are described in the BoxSizer Tutorial.
The last statements in the CPanelFrame class definition fit it all into the panel:
self.panel.SetSizerAndFit(sizer)
sizer.Fit(self)
The simplecell_pulse_main.py Script
The main script simplecell_pulse_main.py begins with:
#! /usr/bin/env python
import wx
import time # for timing runs

# import the non-graphical model simulation script
import simplecell_pulse_sim

# import the script defining the Control Panel frame used to control the simulation
import cpanel_pulse_inject

# import the script defining the Xgraph class for creating y vs. x plots
import GXgraph

# Define the class that links the model simulation to the control panel
class simplecellApp(wx.App):
  def OnInit(self):
    # create an instance of the simulation with model and I/O interfaces
    self.mySim = simplecell_pulse_sim.G3Sim()

    # create the Control Panel frame to hold the buttons, and other widgets
    self.frame = cpanel_pulse_inject.CPanelFrame()
Now, when an object of class simplecellApp is created, it will contain an object 'mySim' to contain the non-graphical part of the simulation, as well as a Control Panel 'frame' to control it.
As we have seen in the previous tutorial, model and simulation parameters are contained in simplecell_pulse_sim.py, which defines a class G3Sim() that is specific to this particular simulation, but not to its interface. On instantiation, it loads a cell model, which in this case, is 'cells/simplecell-nolib.ndf', and sets up a simulation with a pulsegen to provide pulsed current injection to the cell soma. It has the option (set as the default) to use a 'live_output' output device as well as output to a file with 'double_2_ascii' to output the soma membrane potential Vm. With minimal modifications, it could use another cell model such as the edsjb1994 Purkinje cell model used in the SSPy test script 'tests/python/pulsegen_freerun_api.py'. The 'cpanel_pulse_inject.py' GUI is a generalized for injection to any cell model, so Steps 4 and 5 are performed in the model-specific script 'simplecell_pulse_main.py'.
First, Step 4 associates each widget (except the labels) with an event and the name of the method (function) to be invoked when it occurs. This is performed by invoking the 'Bind()' method on the parent of the widget:
# Bind an event (e.g., a mouse click) in a widget to the method to be executed
self.frame.Bind(wx.EVT_BUTTON, self.OnReset, self.frame.reset_button)
self.frame.Bind(wx.EVT_BUTTON, self.OnRun, self.frame.run_button)
self.frame.Bind(wx.EVT_BUTTON, self.OnQuit, self.frame.quit_button)

self.frame.Bind(wx.EVT_TEXT_ENTER, self.OnTmaxEntry, self.frame.tmax_dialog.entry)

self.frame.Bind(wx.EVT_BUTTON, self.OnInjToggle, self.frame.inj_toggle)

# require an 'Enter' in the text entry
self.frame.Bind(wx.EVT_TEXT_ENTER, self.OnTmaxEntry, self.frame.tmax_dialog.entry)
self.frame.Bind(wx.EVT_TEXT_ENTER, self.OnInjEntry, self.frame.inj_dialog.entry)
self.frame.Bind(wx.EVT_TEXT_ENTER, self.OnDelayEntry, self.frame.delay_dialog.entry)
self.frame.Bind(wx.EVT_TEXT_ENTER, self.OnWidthEntry, self.frame.width_dialog.entry)
self.frame.Bind(wx.EVT_TEXT_ENTER, self.OnIntervalEntry, self.frame.interval_dialog.entry)
self.frame.Bind(wx.EVT_BUTTON, self.OnOverlayToggle, self.frame.overlay_toggle)
For the all of the widgets except the XDialog widgets, the event is a mouse click, specified by 'wx.EVT_BUTTON'. The compound XDialog widgets contain a TextCtrl widget that can report an event either any time the content is changed (wx.EVT_TEXT) or whenever the 'Enter' key is pressed in the entry area (wx.EVT_TEXT_ENTER). In this case, we have used 'wx.EVT_TEXT_ENTER' to replicate the behavior of the XODUS 'xdialog', that requires the user to press 'Enter' before any change is recognized. Many modern applications accept a change in a text entry field without requiring an 'Enter'. This can be accomplished with 'wx.EVT_TEXT', but the function that processes the event (e.g. 'OnTmaxEntry' would need to do additional checking to see if there is a valid entry, before using a partial result that was returned while the field is being edited.
The OnInit definition continues on to display the Control Panel and to create and show a graph from the Xgraph class in the GXgraph.py module:
# Display the Control Panel GUI
self.frame.Show()

# Display the Control Panel GUI
self.frame.Show()

# Create a plot for the results
self.Vm_plotframe = GXgraph.Xgraph(title='Soma Membrane Voltage',
       xmin=0.0, xmax=self.mySim.tmax, ymin=-0.1, ymax=0.05, verbose = True)
self.Vm_plotframe.canvas.draw()
self.Vm_plotframe.Show()

# Initialize the Control Panel dialog entry fields
self.InitDialogs()

return True
# end of OnInit
The method to initialize the XDialog entries is defined next:
def InitDialogs(self):
    self.frame.tmax_dialog.entry.ChangeValue(str(self.mySim.tmax))
    self.frame.inj_dialog.entry.ChangeValue(str(self.mySim.injcurrent))
    self.frame.delay_dialog.entry.ChangeValue(str(self.mySim.injdelay))
    self.frame.width_dialog.entry.ChangeValue(str(self.mySim.injwidth))
    self.frame.interval_dialog.entry.ChangeValue(str(self.mySim.injinterval))

    # Also initialize the toggle states
    self.frame.inj_toggle.SetValue(True)
    self.OnInjToggle(wx.EVT_BUTTON) # Now act on the new state
    self.frame.overlay_toggle.SetValue(False)
    self.OnOverlayToggle(wx.EVT_BUTTON) # Now act on the new state
The default values of dialog entries in the Control Panel are likely to be different from those specified in the model simulation, so this changes them to the values used in the simulation 'mySim'. The toggles are initialized to ON for injection, and OFF for plot overlays by faking a mouse click with a call to the event processing method using the argument 'wx.EVT_BUTTON'.
Step 5 defines these functions that are linked to the widget events, which come next. These generally involve calling methods that are defined in the 'simplecell_pulse_sim.py' simulation script. The three buttons use:
def OnQuit(self, event):
    self.Exit()

def OnReset(self, event):
    print "Resetting simulation to initial conditions"
    self.mySim.scheduler.Reset()
    self.Vm_plotframe.Reset()

# This will run the simulation with the given time
def OnRun(self,event):
    simulation_time = self.mySim.tmax
    print 'Starting simulation: system time = ', time.time()
    self.mySim.run_simulation(simulation_time)
    print 'Simulation Complete! system time = ', time.time()
    data = self.mySim.Vm_live_out.GetData()
    self.Vm_plotframe.PlotData(data)
OnQuit simply calls the Exit() method of the application that will become 'mySim'. OnReset calls the Reset() method of the scheduler in order to reset the simulation, and also of the graph ('Vm_plotframe') in order to clear it, unless it is in overlay mode.
The OnRun method gets the desired simulation time 'tmax' from mySim, and calls the 'run_simulation(simulation_time) method. It also arranges for the plotting by getting the data from the 'Vm_live_out' object with its GetData() method and using it in the PlotData() method of the graph.
Note a limitation of the present implementation: Here the plotting cannot be performed until 'run_simulation' is finished, rather than while it is running. A future version of this example will allow the simulation and the plotting to run in separate threads so that they can be performed concurrently.
The OnTmaxEntry method simply sets tmax for the simulation in 'mySim':
def OnTmaxEntry(self, event):
    self.mySim.tmax = float(self.frame.tmax_dialog.entry.GetValue())
    print 'Setting run time to: ', self.mySim.tmax
and the methods for the injection parameters all set the appropriate pulsgen parameters, for example:
# Get and set the injection current
def OnInjEntry(self, event):
    self.mySim.injcurrent = float(self.frame.inj_dialog.entry.GetValue())
    print 'injection: ', self.mySim.injcurrent
    self.mySim.my_pulsegen.SetLevel1(self.mySim.injcurrent)
Note that the entry field value must be a string, and the 'tmax' variable in 'mySim' is a float. As with the statements in the InitDialogs method, type conversion must be performed on the variable.
The methods for the toggle are a little more complicated, because they need to set the widget appearance, as well as react to the toggle state. The injection toggle is processed with:
def OnInjToggle(self, event):
     state =  self.frame.inj_toggle.GetValue()
     self.frame.inj_toggle.OnToggle()
     if state:
         print("Injection is ON")
         self.mySim.my_pulsegen.SetLevel1(self.mySim.injcurrent)
     else:
         print("Injection is OFF")
         self.mySim.my_pulsegen.SetLevel1(0.0)
After retrieving the state of the toggle with GetValue(), it calls the toggle method 'OnToggle()' to set the appearance. This method does not need to use the state, because the toggle knows its own state. Then, an if block is used to set the pulsegen level to the injection current if the state is 'True' (ON) and to zero if it is 'False' (OFF).
The OnOverlayToggle method is similar, but it is used to set the 'overlay' flag of the Vm_plotframe graph to True or False, depending on the toggle state. When the graph Reset() method is invoked from the RESET button, it uses this to determine whether to clear the graph or let the new data be plotted over the old.
Finally, the script ends with the simple loop that we saw in 'simplecell_pulse_sim.py' in order to keep the appliacation running until it is closed with the QUIT button:
if __name__ == '__main__':
    app = simplecellApp(False)
    app.MainLoop()
The G2Xwidgets.py and GXgraph.py Scripts
This section can safely be ignored on a first use of the tutorial. If you are happy with the appearance and behavior of the objects made from the G2Xwidgets classes, and the features provided by the 'Xgraph' class, there should be little need to dig into the two scripts 'G2Xwidgets.py' and 'GXgraph.py'.
However, an examination of these scripts may be useful in order to understand how the default widget appearance is set, and how they can be customized for your own purposes. Here are some notes to help you understand these scripts.
The standard wxPython button widget classes such as Button, ToggleButton, and text entry field (TextCtrl) are built on top of the multi-language and multi-platform wxWidget set that has a different appearance under different operating systems. The widget classes defined in the file G2Xwidgets.py make use of an alternate library of widgets for buttons and similar classes. This library of 'generic buttons' is implemented in Python with a consistent appearance across platforms, and also gives better control over the appearance, including colors and bevel width. These are contained in the imported library 'wx.lib.buttons'. This library includes the GenButton and the GenToggleButton. Reference documentation for these classes can be found in the wx.lib.buttons module reference.
This library does not include a generic replacement for the StaticText class that is used for labels. Instead, the GenStaticText class is taken from the imported library 'wx.lib.stattext'. There is no generic equivalent to the TextCtrl, so the standard wxPython version is used instead.
This link provids basic documentation for the GenStaticText class.
The design of the G2Xwidgets classes was influenced by the online tutorial Creating custom widgets and its use of the GenStaticText class.
With this reference material, the listing of G2Xwidgets.py should be understandable. Note the use of the required British spelling of the methods to set widget colors, e.g.:
self.SetBackgroundColour('#0000CD')
self.SetForegroundColour('white')
and the use of the methods:
self.SetMinSize((-1,30))
# Increase readability by using a bold font the label text
self.SetFont(wx.Font(10, wx.DEFAULT, wx.NORMAL, wx.BOLD))
self.SetWindowStyleFlag(wx.ALIGN_CENTER)
The SetMinSize method takes a tuple (width, height), where the '-1' sets the minimum width of the widget to the default size, or to that of its container. We want the widgets to have standard height of 30 pixels, so the minimum height is '30'.
class XDialog is derived from a Panel. The initialization code creates a label 'entry_label' made from GenStaticText and a text entry field 'entry', made from the standard wxPython TextCtrl. These are placed in the panel ('self') with a horizontal BoxSizer.
The script GXgraph.py defines a class Xgraph, which is derived from Frame. Thus, it is a complete window that appears containing a graph and its controls. Most of the display is done with the use of Matplotlib classes that do all of the difficult work. The code for this script was taken from the G3Plot 'G3Plot.py' stand-alone plotting application and the initialization code 'gtube/plot/__init__.py', which is used for the g3plot utility. Both G3Plot.py and g3plot are installed with the current G-3 version.
If you intend to modify or further develop the 'GXgraph.py' script, or integrate other stand-alone G3 visualization tools into simulation scripts, documentation for Matplotlib will be essential. Documentation can mainly be found on the Matplotlib web site. The book Matplotlib for Python Developers gives good examples of using Matplotlib with Python that go beyond those on the Matplotlib site. The web site for the book has downloads of the example scripts and some sample chapters.
What Next?
There are many other single cell models in the NDF 'cells' library that can be explored using variations of these example scripts. As shown in the previous tutorial Creating GENESIS 3 Simulations with Python, the FREQUENCY parameter of a synchan may be used to produce Poisson-distributed random activation with a specified average frequency. As an exercise, you could add a 'Frequency' Xdialog widget to the contral panel and experiment with random synaptic activation of your cell model.
Future tutorials will use variations of these scripts to provide a template for simulations and their GUIs for network modeling and for the use of the Chemesis3 component to model calcium reactions and diffusion in cells.
Stay tuned ...