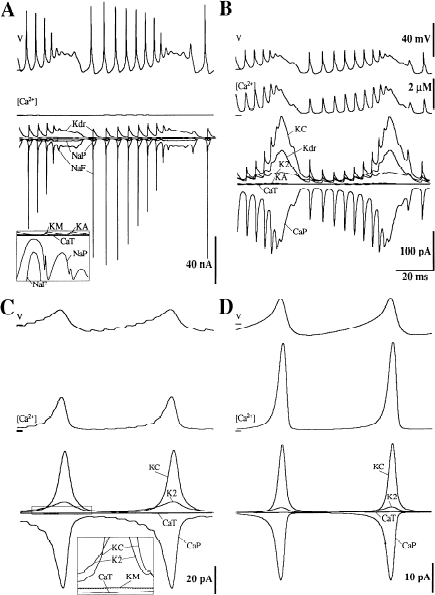
| Figure 1: | Dynamic change in model variables during somatic and dendritic
spikes. The same 100 ms sequence is shown at 4 representative locations in
the model during a 2.0 nA current injection in the soma, 900 ms after the
start of the current injection (model PM9). A: Soma. B: Main dendrite.
C: Smooth dendrite. D: Spiny dendrite. Each part of the figure shows the
membrane potential (V, top trace), the Ca2+ concentration ([Ca2+], middle
trace), and the amplitude of all ionic currents (superimposed bottom traces)
in the compartment. A and C: Part of the current traces enlarged in a small
box. The scale bars for voltage and concentration are identical in all sections.
For the ionic currents each section is scaled differently (outward currents
upward). Horizontal bar at left of V traces: -50 mV membrane potential.
Horizontal bar at left of [Ca2+] traces: 0 μM concentration. See Table 1 for
abbreviations. |