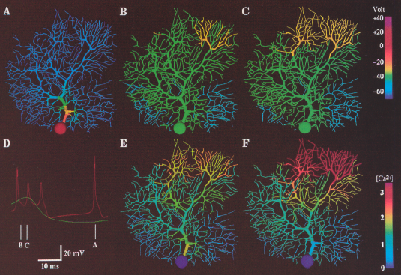
| Figure 1: | False color representation of membrane potential and Ca2+
concentration in the complete model during a 2.0 nA current injection in the
soma. A: Membrane potential distribution during a somatic action potential.
B: Membrane potential distribution at the beginning of a dendritic spike. C:
Membrane potential distribution 1.6 ms later, when the dendritic spike had
peaked. D: Somatic (red) and dendritic (green) recordings with the times
when images A–C were taken indicated. E: Submembrane Ca2+ concentration
at same time as B. F: Submembrane Ca2+ concentration at same time as C.
Note the nonlinear voltage scale, which is expanded between -60 and -20 mV. |