Related Documentation:
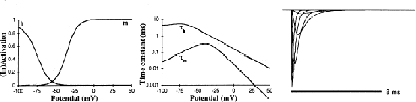
The fast sodium (NaF) current is responsible for the depolarization phase of the somatic action potential; there are no somatic spikes when this current is blocked by tetrodotoxin (TTX– [4]). The NaF current is difficult to voltage clamp because of its fast activation kinetics and its large conductance. Until now nobody has attempted a complete voltage-clamp study of this current in Purkinje cells. In modeling papers one can trace an evolution of modifications to the original Hodgkin-Huxley [3] equations [5, 6, 7]. Most of these modifications were, to our knowledge, not based on firm experimental data. We have derived our equations for NaF current from the original Hodgkin-Huxley equations [3]. These were modified to accommodate data about steady-state activation of NaF current obtained from outside-out patch-clamp recordings of cultured Purkinje cells (Fig. 4B in [1]). Another report of whole-cell voltage-clamp recordings from cultured Purkinje cells (Fig. 7B in [2]) provided a current-voltage (I–V) relation for the peak NaF current with a comparable activation threshold, but corresponding to a somewhat shallower slope of the activation curve. Both reports also contained some data on the time to peak of the NaF current. The modifications based on these two reports resulted in a steeper steady-state activation curve with a higher threshold and slower kinetics (at room temperature) than the original Hodgkin-Huxley equations [3]. Figure 4B in [1] also provided steady-state inactivation data, which resulted in a shallower inactivation curve with slower kinetics.
[1] B Gähwiler and I Llano. Sodium and potassium conductances in somatic membranes of rat purkinje cells from organotypic cerebellar cultures. Journal of Physiology (Lond.), 417:105–122, 1989.
[2] T Hirano and S Hagiwara. Kinetics and distribution of voltage-gated Ca, Na, and K channels on the somata of rat cerebellar Purkinje cells. Pfluegers Archiv, 413:463–469, 1989.
[3] A Hodgkin and A Huxley. A quantitative description of membrane current and its application to conduction and excitation in nerve. Journal of Physiology (Lond.), 117:500–544, 1952.
[4] RR Llinás and M Sugimori. Electrophysiological properties of in vitro Purkinje cell somata in mammalian cerebellar slices. Journal of Physiology (Lond.), 305:171–195, 1980.
[5] WW Lytton and TJ Sejnowski. Simulations of cortical pyramidal neurons synchronized by inhibitory interneurons. Journal of Neurophysiology, 66:1059–1079, 1991.
[6] RD Traub. Simulation of intrinsic bursting in CA3 hippocampal neurons. Neuroscience, 7:1233–1242, 1982.
[7] MA Wilson and JM Bower. The simulation of large-scale neuronal networks. In C Koch and I Segev, editors, Methods in Neuronal Modeling, pages 291–334. MIT Press, 1989.