Plot files of one (x,y) pair, or (time, V m) pair per line from a single file given as the argument, e.g.
fplot.py Vm.out
|
An extended version of fplot.py that uses the Matplotlib object-oriented classes, instead of the Matlab-like pylab commands. It takes multiple wildcarded filenames as arguments, and plots them in different colors on the same axes, e.g.
plotVm.py Vm.out pyr4*.out
|
It has labels and scales specific for membrane potential plots, and is handy for quickly comparing the results of current injection simulations. The (x,y) coordinates of a point on the graph can be displayed in the Navigation Toolbar by positioning the cursor over it.
Similar to plotVm, but specialized for creating raster plots of firing times for a group of neurons. It takes a single filename as argument, with a line for each cell containing the spike times separated by spaces. The times are plotted as dots with the time on the x-axis and the cell number (the line number) on the y-axis.
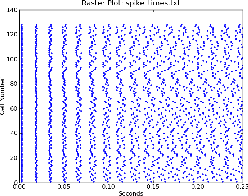
Figure 1 shows a plot generated with
rasterplot.py spike_times.txt
|
Enhanced version of plotVm that wraps Matplotlib plots within a wxPython GUI. It has several fancy Help menu features and plotting options to illustrate the capabilities of wxWidgets as a GUI for displaying simulation results in Python. It can either take the filename list as arguments, or to be entered in a dialog from the File/Open menu selection.
It addition to the usual Menu bar with File and Help menus, it has a Control Panel of colored buttons and toggles for clearing the plot, plotting, setting overlay ON or OFF, and toggling the Legend display. The Legend identifies each colored line on the graph with the filename in the same color.
The HTML Usage help describes the use of the Matplotlib Toolbar that is used in all these programs, as well as Menu choices and Control Panel buttons. The Program Info scrolling message dialog gives information obtained from program documentation strings about the objects and functions, and the wxPython and matplotlib classes that are used here.
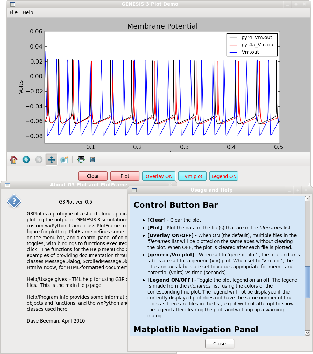
Figure 2 shows a screen dump of the GUI with Usage and About help displayed with the plot.
The screen dump was produced with the following command and arguments:
G3Plot.py pyr4*.out Vm.out
|
This is a utility for analyzing network activity by displaying a filled contour map of spike frequency vs. simulation time for groups of neurons. It takes a single filename as argument, with a line for each time step containing the simulation time, followed by the average spike frequency (firing rate) during that time step for each group of cells. Typically each cell group is a horizontal row of cells in the network that are receiving auditory input. Time is plotted on the x-axis, cell group (row) on the y-axis, with the average firing frequency of cells in that row at that time represented by a colored filled contour plot.
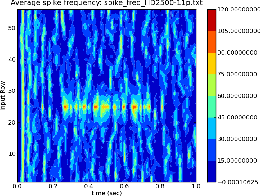
Figure 3 (called freqplot-HD2500-11p.eps) shows the contour plot generated from
rowrateplot.py spike_freq_HD2500-11p.txt
|
The data file was produced from asc_file output of a G-2 layer 4 auditory cortex simulation. The parameters used for the connection weights in this run provided strong response to the random background input, and to a 220 Hz tone pulse with thalamic input to row 25 and nearby rows, lasting from 0.25–0.75 s. rowrateplot.py will be useful for tuning parameters to balance excitation and inhibition.