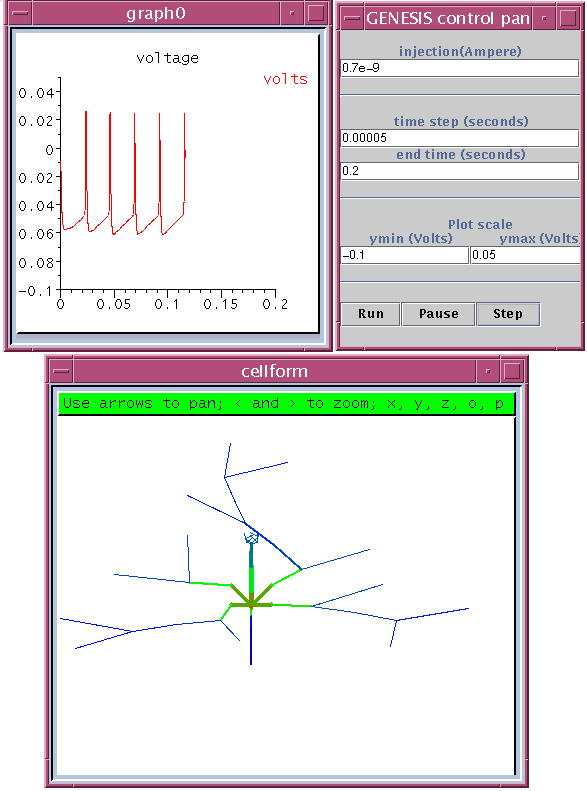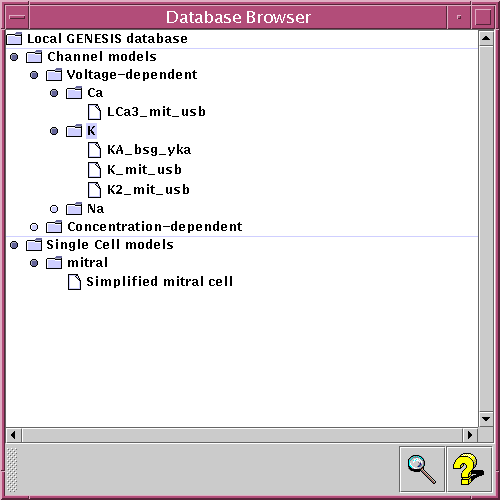

The Workspace also provides a set of query interfaces which will allow a user to specify a number of restrictions on the data to be retrieved. These restrictions can be combined by using logical operators (such as and, or and not). In order to spare the user from learning the details of database query languages, the query interfaces will be based on a system of pull-down menus (see image).
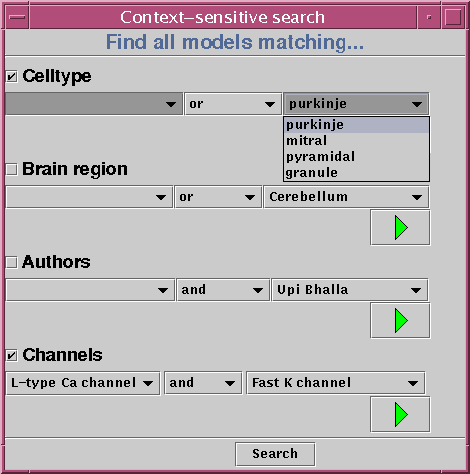
Once the user has assembled a query using the interface shown above, all matching models will be retrieved from the database. In the case that there are several models that fit the criteria, they will all be displayed together. This lets the user see immediately how certain important parameters may vary over large sets of models. In the example below, the we have looked for models that contain L-type calcium channels. The display uses color-coding to represent the conductance density of this channel type throughout the model.

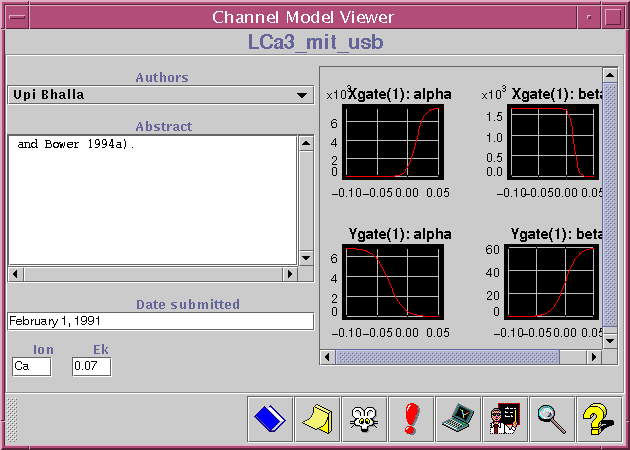
The window shown above displays vital information about a certain channel model. Among the data shown is authors, date, abstract, equilibrium potential, and principal ion. The curves to the right are perhaps the most important part of the channel viewer; they show the activation/inactivation characteristics of this channel. In future versions of the Workspace, it will be possible to manipulate the shape of these curves directly, thereby creating a modified version of this channel which can be tested in simulations.
The toolbar at the bottom of the window contains buttons that leads to further data related to this channel model: notes, references, experimental data, tutorials, and GENESIS simulations.
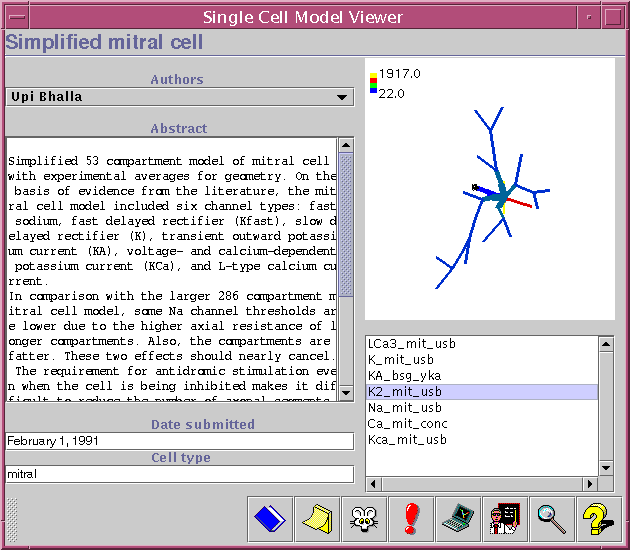
The Single cell model viewer has a lot in common with the Channel model viewer (described above). The main difference between the two is that the Single cell model viewer contains a 3D image of the cell morphology, which can be rotated and zoomed. Below the morphology there is a list of all channels which appear in this model. By selecting items from this list, the user can view the density distribution of the different channels.
The image below shows the user interface for running tutorials from the Workspace. Each tutorial may be divided into different parts, each of which contains detailed instructions and an explanation of why the model behaves as it does. A number of slide bars may also be provided - these let the user manipulate certain sensitive parameters in the model and see the effect in the simulation.
Clicking on the "Start" button starts a GENESIS
simulation, the parameters of which are stored in the database
together with the tutorial.

The image below shows the result of a current clamp simulation that was run via the tutorial. In order to create this, the Modeler's Workspace
The colors in the cell display represent the membrane potential in the various comaprtments of the model, and indicate an active propagation of action potentials into the dendrites.
